How to Use Data Analytics to Improve Customer Experience: A Step-by-Step Guide
Data analytics for customer experience is no longer optional — it’s the secret weapon of companies that delight and retain more customers. In a digital-first economy, customer experience (CX) has become the ultimate differentiator. With rising expectations and countless touch-points, businesses must deliver not only great products but also frictionless, personalized journeys. Data analytics empowers organizations to uncover patterns, anticipate needs, and craft meaningful customer experiences.
In this guide, we break down how to use data analytics step-by-step to elevate your CX strategy.
Step 1: Understand Key Customer Experience Metrics
Before diving into data, identify the right metrics. Effective CX measurement hinges on choosing indicators aligned with business goals.
Common CX KPIs:
- Net Promoter Score (NPS)
- Customer Satisfaction Score (CSAT)
- Customer Effort Score (CES)
- Churn Rate
- First Response Time (FRT)
- Customer Lifetime Value (CLV)
Why This Matters: Tracking the right metrics helps you target the areas that impact loyalty, retention, and referrals.
Step 2: Collect and Organize Customer Data
Next, gather customer data from multiple touchpoints to build a 360-degree view. Data sources include:
- Website analytics (Google Analytics, Hotjar)
- CRM platforms (HubSpot, Salesforce)
- Surveys and feedback tools (Typeform, Qualtrics)
- Support tickets and call logs
- Social media sentiment analysis
Pro Tip: Use a Customer Data Platform (CDP) to centralize data and reduce silos. Platforms like Segment or Treasure Data can help unify profiles.
Step 3: Identify Pain Points Through Analysis
Once data is aggregated, analyze it to identify customer friction points.
Tools to Use:
- Power BI or Tableau for dashboards
- Google Data Studio for funnel analysis
- Text analysis for open feedback comments
Example: If NPS is low after support interactions, filter data by channel, agent, or issue type to diagnose causes.
Step 4: Take Action With Data-Driven Solutions
Use your insights to prioritize changes. Look for quick wins and high-impact improvements.
CX Optimization Ideas:
- Personalize onboarding journeys based on behavioral data
- Use chatbots to reduce customer wait times
- Streamline checkout for mobile users
- Improve knowledge base articles using most-searched queries
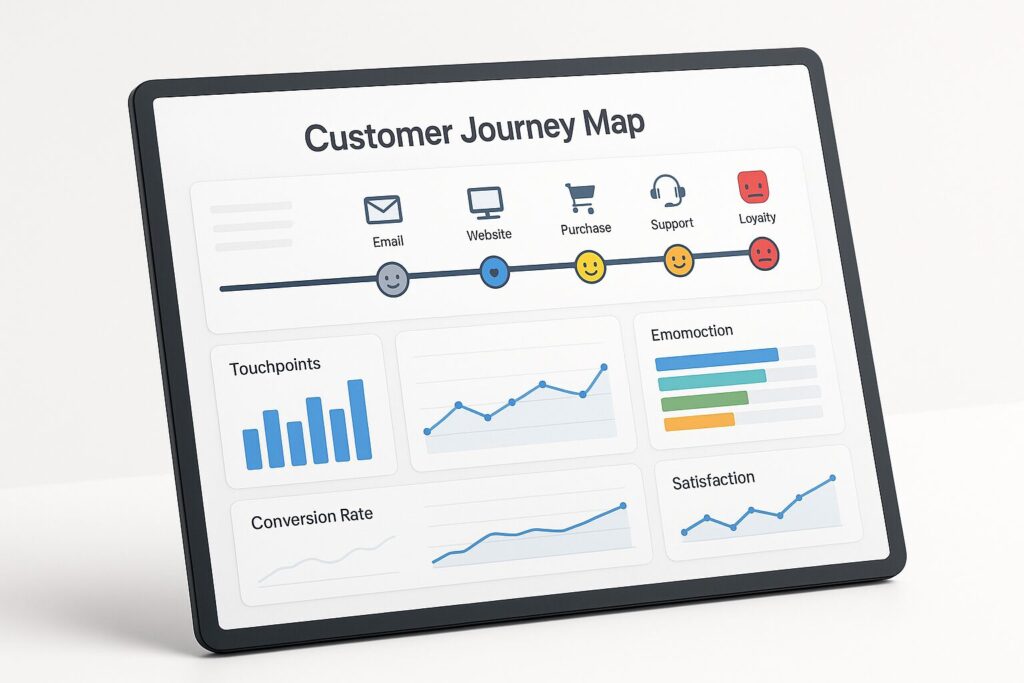
Step 5: Visualize Progress With CX Dashboards
Track your improvements using real-time dashboards. Power BI dashboards should include:
- Time-trended NPS and CSAT
- Churn breakdown by segment
- First-response heatmaps
Download Template: Get our CX Dashboard Starter Kit to start visualizing customer feedback and KPIs today.
How Data Analytics Enhances Customer Experience
Data analytics customer experience” strategies can transform how businesses serve their audiences. By using analytics, teams anticipate issues and resolve them before they become complaints.

Case Study: Reducing Churn with Predictive Analytics
Business Goal
Reduce the churn rate and increase customer satisfaction for a subscription-based fintech platform targeting small and medium-sized businesses (SMBs).
Strategy
Develop a predictive analytics model to flag customers at risk of canceling their subscriptions before renewal.
Key Business Value Drivers
- Increased retention rate
- Decreased support costs through proactive service
- Higher upsell and cross-sell potential
Objectives
- Achieve a churn rate reduction of at least 15% within one quarter
- Improve NPS by 10 points within 6 months
- Boost CSAT on support tickets by 20%
KPIs
- Monthly churn rate
- Net Promoter Score (NPS)
- First Response Time (FRT)
- Resolution Time
Data Sources
- Support ticket system (Zendesk)
- Subscription billing data
- Usage logs from web and mobile apps
- Customer satisfaction surveys
Activities and Execution
- Data Aggregation: Unified support and product usage data into a centralized data lake
- Exploratory Analysis: Identified behavior patterns leading to churn (e.g., reduced logins, repeat support issues)
- Modeling: Developed a Power BI predictive model using DAX and integrated ML output from Azure ML
- Automation: Triggered CRM follow-up for flagged users through Microsoft Power Automate
- Reporting: Created a CX dashboard with churn risk segments, agent performance, and retention actions
Outcome
In just 90 days:
- Churn reduced by 18%
- NPS increased by 12 points
- FRT improved by 40%
Lesson Learned
- Small signals in customer support logs can predict churn
- Proactive intervention builds loyalty and reduces support costs
- Executive visibility through live dashboards accelerated adoption of CX initiatives
What You Can Implement Right Now
- Set up a Power BI dashboard using CSAT, churn, and support data
- Create simple risk signals based on behavior and ticket tags
- Automate follow-up actions via Power Automate or Zapier
Recommended Tools
- Power BI – Interactive data visualization
- Hotjar – Behavioral analytics and feedback
- Qualtrics – Survey and voice-of-customer platform
- Google Analytics 4 – Website engagement and conversions
- Segment – Customer Data Platform
Final Thoughts
Using data analytics to improve customer experience isn’t about collecting more data—it’s about making better decisions with it. Start small, focus on what matters, and build a culture of continuous improvement.
Grab the Free CX Analytics Dashboard Template
Streamline your customer experience analysis with our ready-to-use Excel template. Built for real-world results—just plug in your data and start making better decisions today.